A Brief Explanation of This Demo
If you want to get started, you can generate data here and detect anomalies here
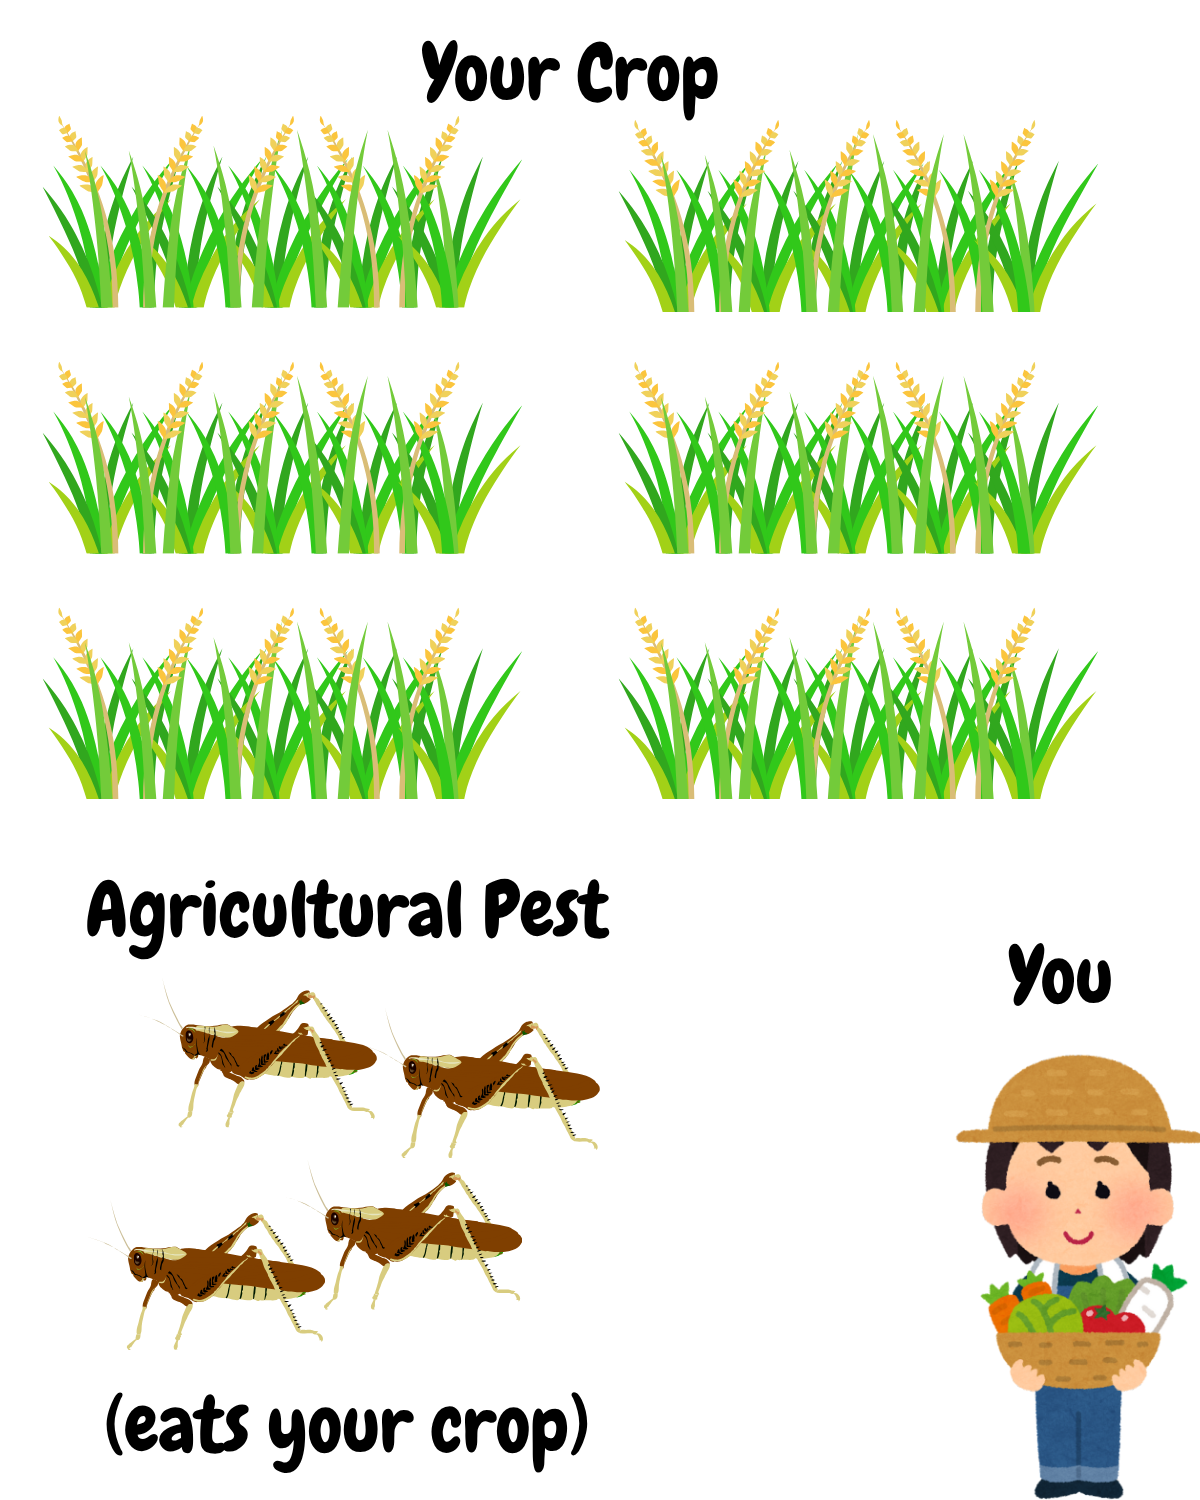
Imagine this scenario: you are a farmer harvesting crops while also dealing with agricultural pests—mainly insects such as locusts that can damage your produce. To protect your crops, you must monitor the pest population closely to ensure it doesn’t exceed a critical threshold beyond which it could harm your productivity. But how can this be done effectively?
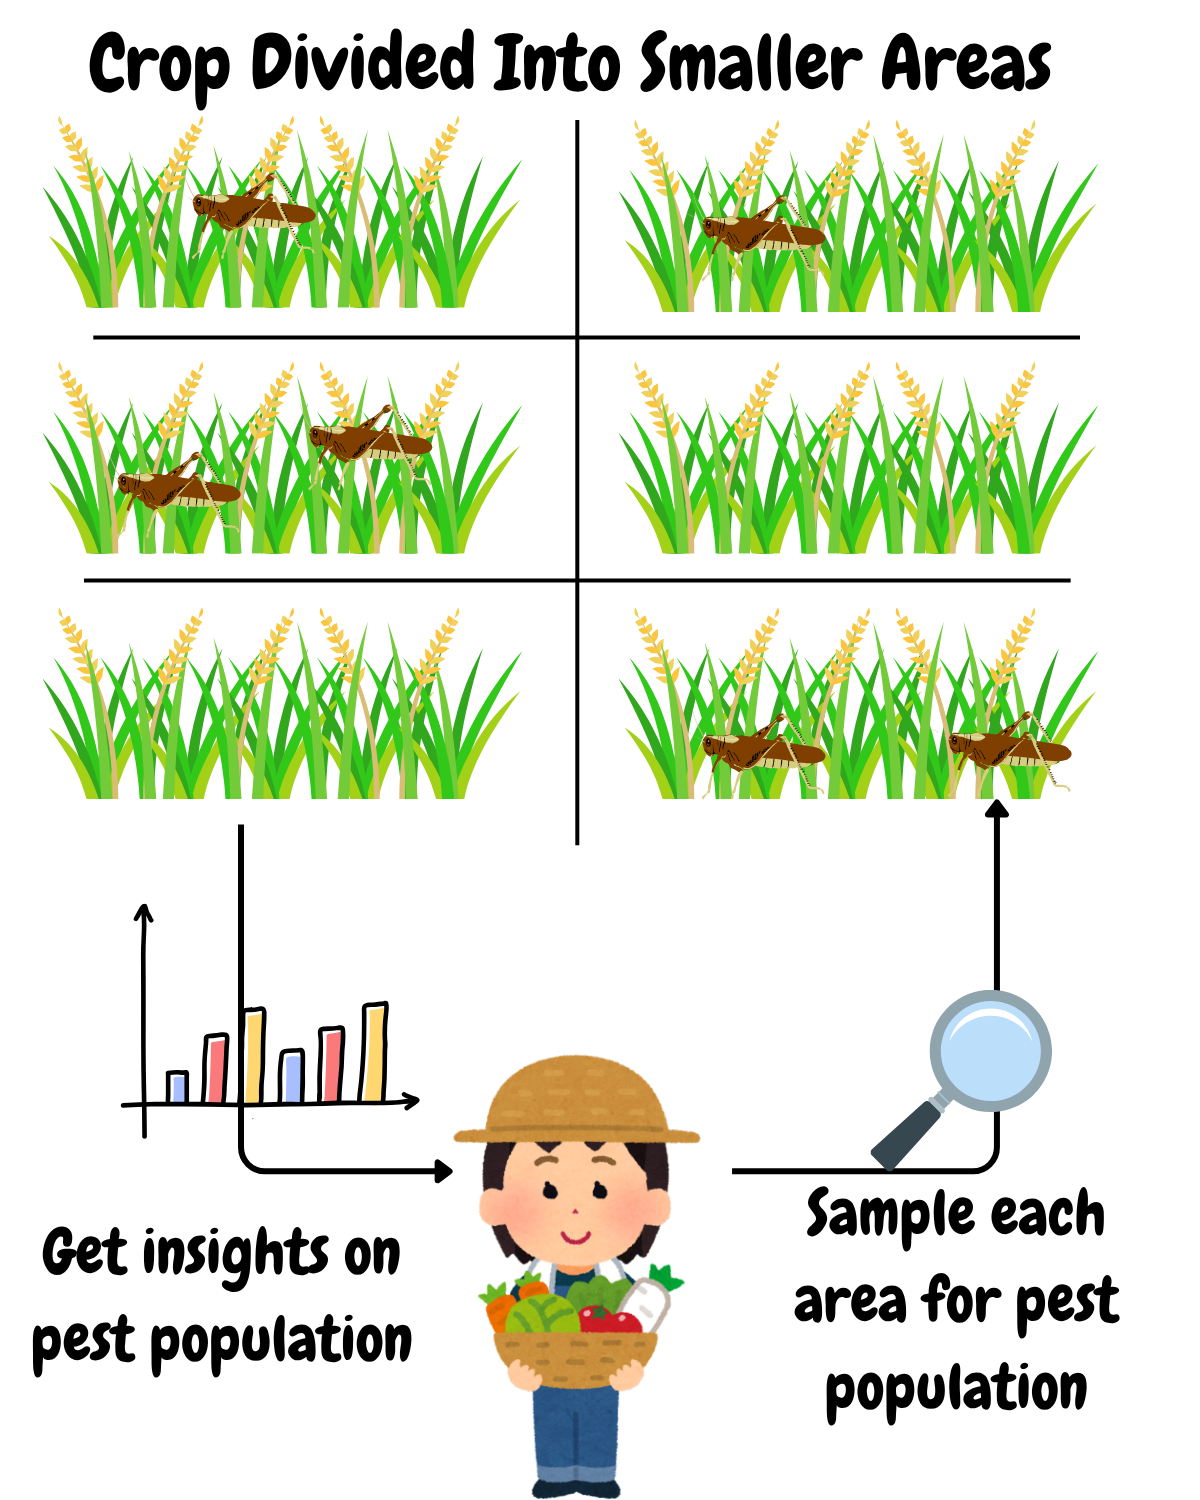
A common approach to population monitoring is to divide the area of interest into smaller sub-areas. In this demo, we use 100 sub-areas, each equipped with a monitoring station. At regular intervals, these stations record the number of pests observed. The collected data helps determine whether the pest population is stable or growing abnormally.
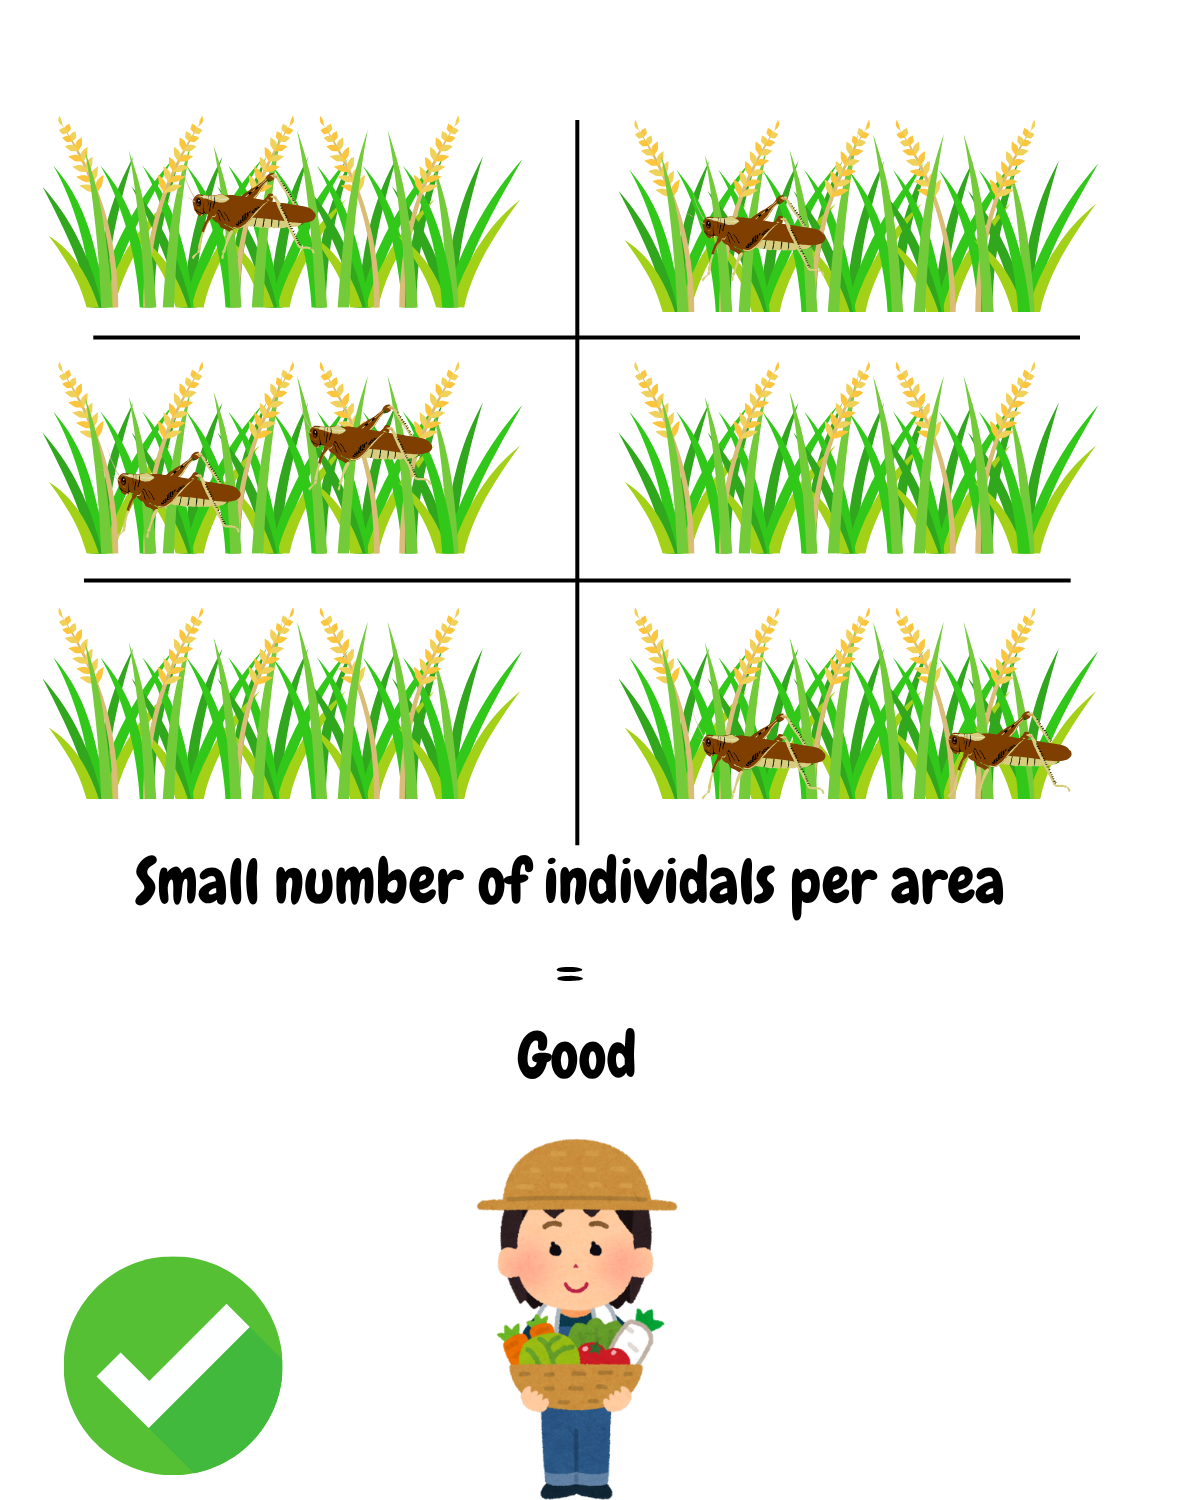
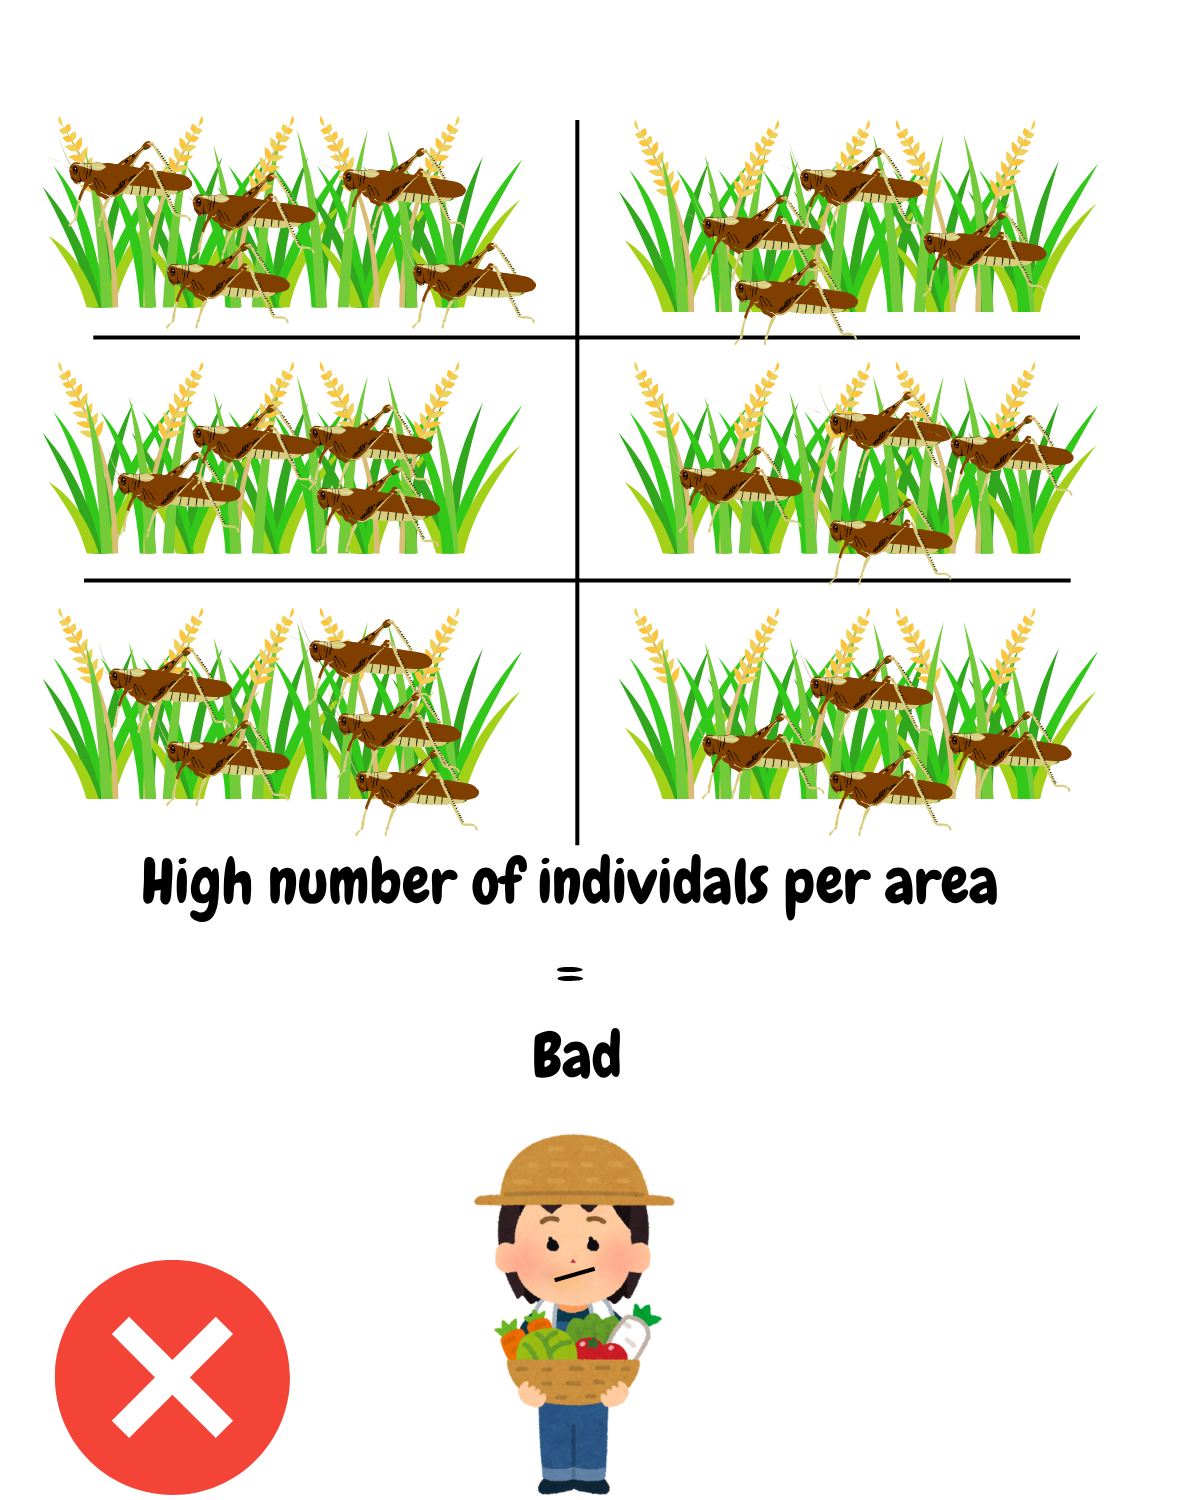
When the number of recorded pests per sub-area is low (between 0 and 10 in this demo), there is little to no risk to the crops. However, if the numbers rise significantly (between 100 and 200 in this demo), it indicates a potential outbreak that could seriously affect productivity.
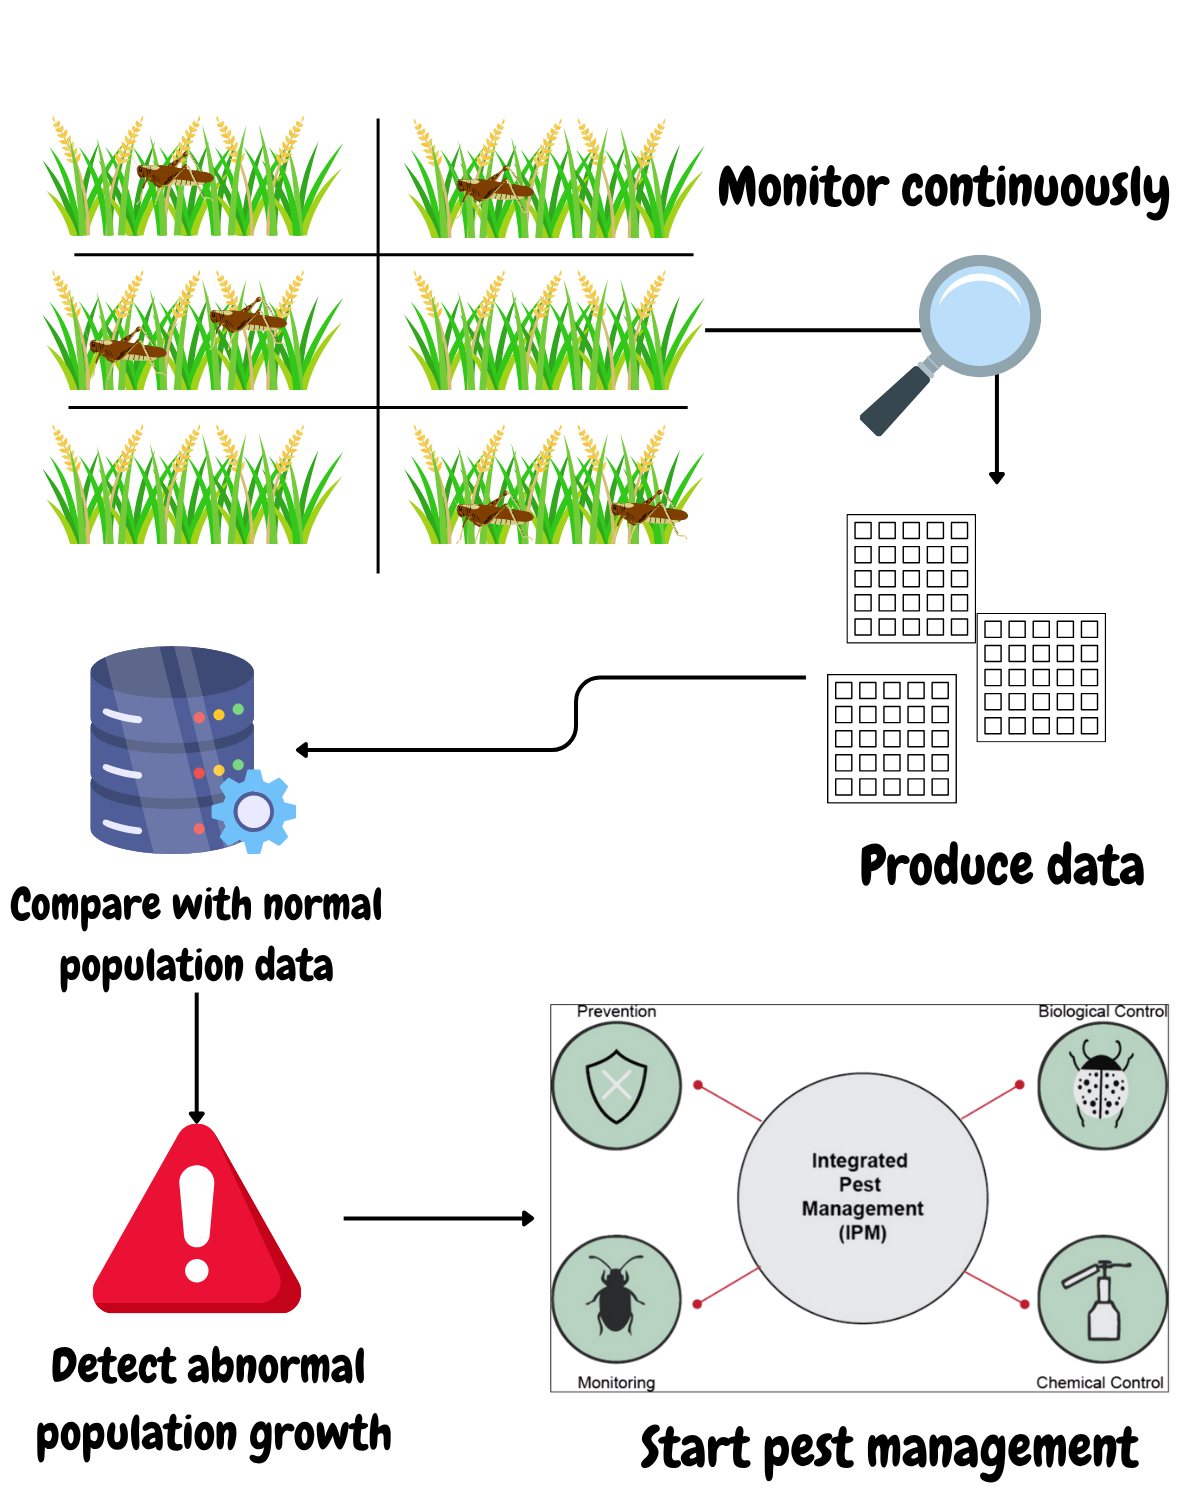
To manage this effectively, we continuously feed data from the monitoring stations into a processing pipeline. This pipeline compares current measurements with reference data that represents normal population levels. In this demo, the data are stored as 100-dimensional vectors—each dimension corresponding to one sub-area—in a vector search engine. Anomaly detection is performed by measuring the distance between the new data and the reference data: if the distance is too large, it signals an anomaly. When such an anomaly is detected, an integrated pest management program should be initiated to keep the pest population under control.
Since we do not have real data from monitoring stations in this demo, you can generate your own data and get a sense of the anomaly detection pipeline by running it.